Analysis of univariate random variables
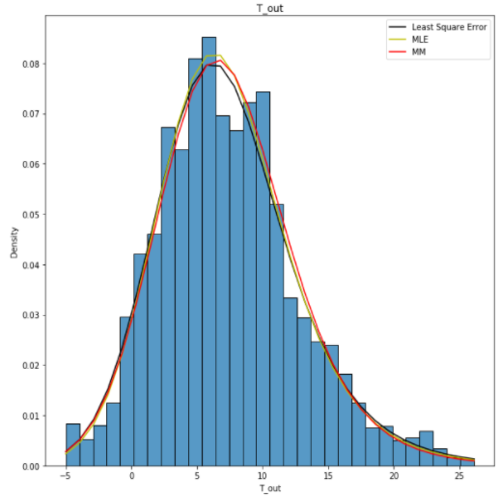
In the figure above, we can see an estimation of distribution to a random variable found by three methods, LSE, MLE, and MM.
The main goal of this task is to estimate the distribution function of a univariate random variable.
In order to acheive that, I've applied several steps:
First, plotting a non-parametric estimation of PDF because it helps determine the likelihood of the random variable falling within a specific range of values.
Then, by plotting “box with whiskers” we can gain a more statistics estimation and find the outliers in the data.
After that, we can expect a theoretical distributions that best reflect the empirical data.
So, then we can estimate the random variable distribution parameters using maximum likelihood technique and Least Sequares methods.
Finally, a validation of empirical and theoretical distributions is performed using quantile biplots, in addition to some statistical tests.
To learn more details and check the code, please follow the link here.
Analysis of multivariate random variables
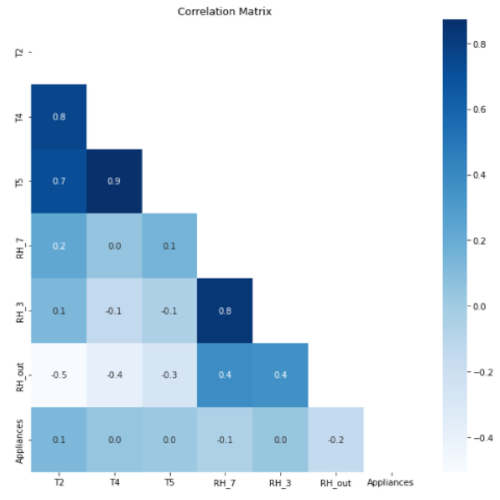
In the figure above, we can see a correlation matrix for the random variables in the target data.
The main goal of this task is to find a model that can relate between the target and predictors in the data
In order to acheive that, I've applied several steps:
First, to understand the relationsgips among different variables I have estimated multivariate mathematical expectation and variance.
In addition to estimation of conditional distributions, mathematical expectations and variances.
After that, to unserstand the statistical relationship among different variables, I have estimated pair correlation coefficients,
So, the relationship among the target and predictors is represented by a regression model.
Finally, a quality analysis is performed to check the quality of the found models.
To learn more details and check the code, please follow the link here.
Sampling of multivariate random variables
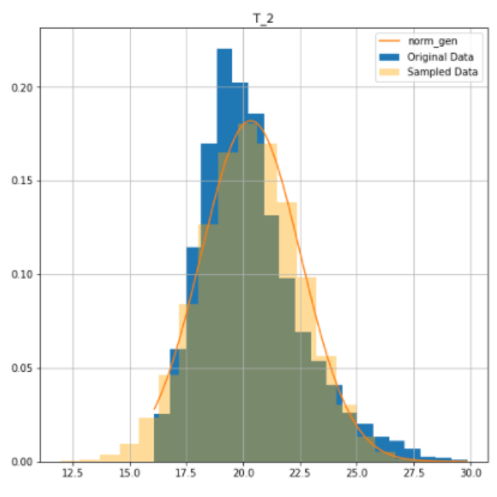
In the figure above, we can see the original and sampled data of a specific variable.
The main goal of this task is to sample multivariate random variable.
In order to acheive that, I've applied several steps:
First, sampling of chosen target variables using univariate parametric distributions with two different sampling methods: Inverse transform sampling, and Accept-Reject Sampling.
Then perform multivariate sampling between predictors and chosen target variables, by different methods: Manual Bayesian network, and Structural learning models.
Finally, a quality analysis is performed to check the quality of the found models.
To learn more details and check the code, please follow the link here.
Stationarity of the processes
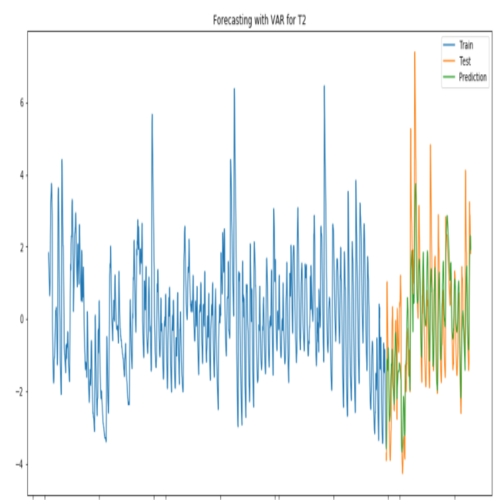
In the figure above, we can a forecast model for a specific random variable.
The main goal of this task is to apply forecasting for random variables
In order to acheive that, I've applied several steps:
First, It is important to analyze the substantiation and stationary of the chosen variables.
Then, according to the result of the previous step, noise filtration may be required.
After that, an auto-regression model (SARIMA model) was trained for the target variables.
Finally, we can forecast the data for the target variables.
To learn more details and check the code, please follow the link here.